SIOP 2018: An Analysis of Tweets Using Natural Language Processing with Topic Modeling
In this post, I’m going to demonstrate how to conduct a simple NLP analysis (topic modeling using latent Dirichlet allocation/LDA) using data from Twitter using the #siop18 hashtag. What I would like to know is this: what topics emerged on Twitter related to this year’s conference? I used R Markdown to generate this post.
To begin, let’s load up a few libraries we’ll need. You might need to download these first! After we get everything loaded, we’ll dig into the process itself.
library(tm)
library(tidyverse)
library(twitteR)
library(stringr)
library(wordcloud)
library(topicmodels)
library(ldatuning)
library(topicmodels)
Challenge 1: Getting the Data into R
To get data from Twitter into R, you need to log into Twitter and create an app. This is easier than it sounds.
- Log into Twitter.
- Go to http://apps.twitter.com and click Create New App.
- Complete the form and name your app whatever you want. I named mine rnlanders R Interface.
- Once you have created your app, open its settings and navigate to Keys and Access Tokens.
- Copy-paste the four keys you see into the block of code below.
# Replace these with your Twitter access keys - DO NOT SHARE YOUR KEYS WITH OTHERS
consumer_key <- "xxxxxxxxxxxx"
consumer_secret <- "xxxxxxxxxxxxxxxxxxxxxxxx"
access_token <- "xxxxxxxxxxxxxxxxxxxxxxxx"
access_token_secret <- "xxxxxxxxxxxxxxxxxxxxxxxx"

# Now, authorize R to use Twitter using those keys
# Remember to select "1" to answer "Yes" to the question about caching.
setup_twitter_oauth(consumer_key, consumer_secret, access_token, access_token_secret)
Finally, we need to actually download all of those data. This is really two steps: download tweets as a list, then convert the list into a data frame. We’ll just grab the most recent 2000, but you could grab all of them if you wanted to.
twitter_list <- searchTwitter("#siop18", n=2000)
twitter_tbl <- as.tibble(twListToDF(twitter_list))
Challenge 2: Pre-process the tweets, convert into a corpus, then into a dataset
That text is pretty messy – there’s a lot of noise and nonsense in there. If you take a look at a few tweets in twitter_tbl, you’ll see the problem yourself. To deal with this, you need to pre-process. I would normally do this in a tidyverse magrittr pipe but will write it all out to make it a smidge clearer (although much longer).
Importantly, this won’t get everything. There is a lot more pre-processing you could do to get this dataset even cleaner, if you were going to use this for something other than a blog post! But this will get you most of the way there, and close enough that the analysis we’re going to do afterward won’t be affected.
# Isolate the tweet text as a vector
tweets <- twitter_tbl$text
# Get rid of retweets
tweets <- tweets[str_sub(tweets,1,2)!="RT"]
# Strip out clearly non-English characters (emoji, pictographic language characters)
tweets <- str_replace_all(tweets, "\\p{So}|\\p{Cn}", "")
# Convert to ASCII, which removes other non-English characters
tweets <- iconv(tweets, "UTF-8", "ASCII", sub="")
# Strip out links
tweets <- str_replace_all(tweets, "http[[:alnum:][:punct:]]*", "")
# Everything to lower case
tweets <- str_to_lower(tweets)
# Strip out hashtags and at-mentions
tweets <- str_replace_all(tweets, "[@#][:alnum:]*", "")
# Strip out numbers and punctuation and whitespace
tweets <- stripWhitespace(removePunctuation(removeNumbers(tweets)))
# Strip out stopwords
tweets <- removeWords(tweets, stopwords("en"))
# Stem words
tweets <- stemDocument(tweets)
# Convert to corpus
tweets_corpus <- Corpus(VectorSource(tweets))
# Convert to document-term matrix (dataset)
tweets_dtm <- DocumentTermMatrix(tweets_corpus)
# Get rid of relatively unusual terms
tweets_dtm <- removeSparseTerms(tweets_dtm, 0.99)
Challenge 3: Get a general sense of topics based upon word counts alone
Now that we have a dataset, let’s do a basic wordcloud visualization. I would recommend against trying to interpret this too closely, but it’s useful to double-check that we didn’t miss anything (e.g., if there was a huge “ASDFKLAS” in this word cloud, it would be a signal that I did something wrong in pre-processing). It’s also great coffee-table conversation?
# Create wordcloud
wordCounts <- colSums(as.tibble(as.matrix(tweets_dtm)))
wordNames <- names(as.tibble(as.matrix(tweets_dtm)))
wordcloud(wordNames, wordCounts, max.words=75)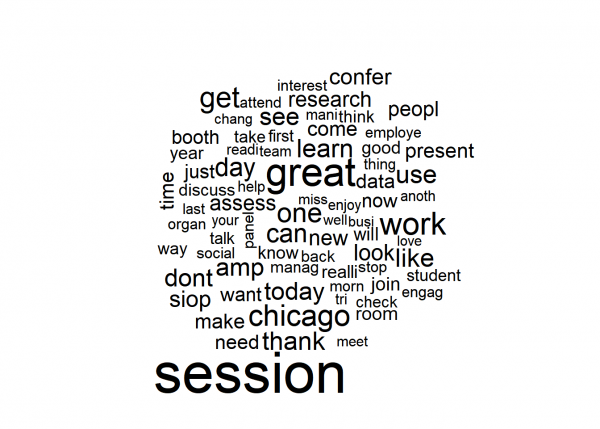
# We might also just want a table of frequent words, so here's a quick way to do that
tibble(wordNames, wordCounts) %>% arrange(desc(wordCounts)) %>% top_n(20)
## # A tibble: 20 x 2
## wordNames wordCounts
## <chr> <dbl>
## 1 session 115
## 2 great 75
## 3 work 56
## 4 chicago 51
## 5 get 49
## 6 one 46
## 7 day 43
## 8 can 43
## 9 like 42
## 10 thank 42
## 11 use 42
## 12 learn 42
## 13 dont 41
## 14 amp 41
## 15 today 40
## 16 see 40
## 17 siop 37
## 18 look 36
## 19 confer 35
## 20 new 34These stems reveal what you’d expect: most people talking about #siop18 are talking about conference activities themselves – going to sessions, being in Chicago, being part of SIOP, looking around seeing things, etc. A few stick out, like thank and learn.
Of course, this is a bit of an exercise in tea-leaves reading, and there’s a huge amount of noise since people pick particular words to express themselves for a huge variety of reasons. So let’s push a bit further. We want to know if patterns emerge within these words surrounding latent topics.
Challenge 4: Let’s see if we can statistically extract some topics and interpret them
For this final analytic step, we’re going to run latent Dirichlet allocation (LDA) and see if we can identify some latent topics. The dataset is relatively small as far as LDA goes, but perhaps we’ll get something interesting out of it!
First, let’s see how many topics would be ideal to extract using ldatuning. I find it useful to do two of these in sequence, to get the “big picture” and then see where a precise cutoff might be best.
# First, get rid of any blank rows in the final dtm
final_dtm <- tweets_dtm[unique(tweets_dtm$i),]
# Next, run the topic analysis and generate a visualization
topic_analysis <- FindTopicsNumber(final_dtm,
                                   topics = seq(2,100,5),
                                   metrics=c("Griffiths2004","CaoJuan2009","Arun2010","Deveaud2014"))
FindTopicsNumber_plot(topic_analysis)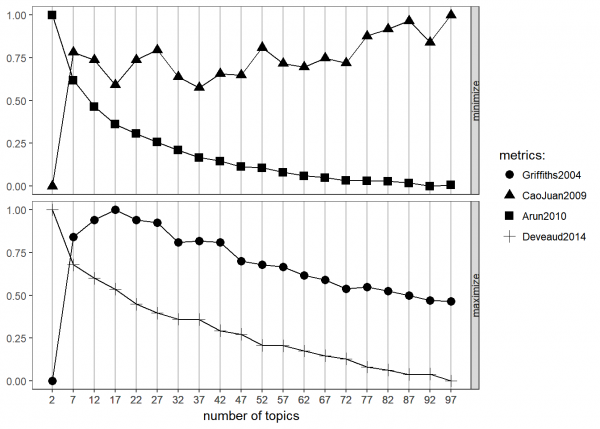
The goal of this analysis is to find the point at which the various metrics (or the one you trust the most) is either minimized (in the case of the top two metrics) or maximized (in the case of the bottom two). It is conceptually similar to interpreting a scree plot for factor analysis.
As is pretty common in topic modeling, there’s no great answer here. Griffiths suggests between 10 and 25 somewhere, Cao & Juan suggests the same general range although noisier, Arun is not informative, nor is Deveaud. This could be the result of poor pre-processing (likely contributes, since we didn’t put a whole lot of effort into spot-checking the dataset to clean it up completely!) or insufficient sample size (also likely) or just a noisy dataset without much consistency. Given these results, let’s zoom in on 10 to 25 with the two approaches that seem to be most helpful.
topic_analysis <- FindTopicsNumber(final_dtm,
                                   topics = seq(10,26,2),
                                   metrics=c("Griffiths2004","CaoJuan2009"))
FindTopicsNumber_plot(topic_analysis)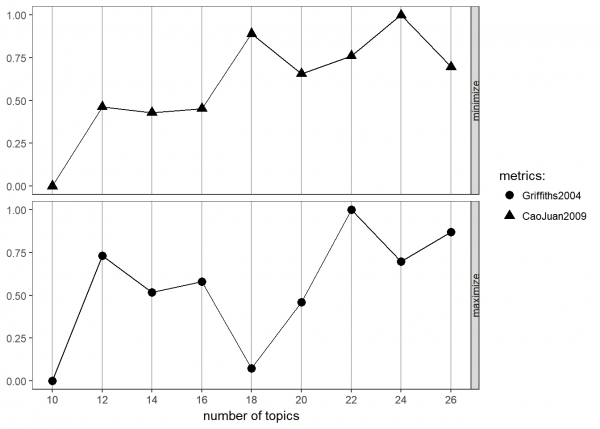
These are both very noisy, but I’m going to go with 18. In real-life modeling, you would probably want to try values throughout this range and try to interpret what you find within each.
Now let’s actually run the final LDA. Note that in a “real” approach, we might use a within-sample cross-validation approach to develop this model, but here, we’re prioritizing demonstration speed.
# First, conduct the LDA
tweets_lda <- LDA(final_dtm, k=18)

# Finally, list the five most common terms in each topic
tweets_terms <- as.data.frame(tweets_lda@beta)  %>% # grab beta matrix
  t %>%           # transpose so that words are rows
  as.tibble %>%   # convert to tibble (tidyverse data frame)
  bind_cols(term = tweets_lda@terms)  # add the term list as a variable
names(tweets_terms) <- c(1:18,"term") # rename them to numbers

# Visualize top term frequencies
tweets_terms %>%
  gather(key="topic",value="beta",-term,convert=T) %>%
  group_by(topic) %>%
  top_n(10, beta) %>%
  select(topic, term, beta) %>%
  arrange(topic,-beta) %>%
  print(n = Inf)
## # A tibble: 180 x 3
## # Groups: topic [18]
## topic term beta
## <int> <chr> <dbl>
## 1 1 chicago -1.32
## 2 1 confer -1.98
## 3 1 home -2.70
## 4 1 bring -3.07
## 5 1 day -3.28
## 6 1 back -3.79
## 7 1 siop -3.97
## 8 1 work -4.01
## 9 1 time -4.03
## 10 1 morn -4.22
## 11 2 research -2.80
## 12 2 session -3.27
## 13 2 can -3.40
## 14 2 need -3.45
## 15 2 work -3.51
## 16 2 team -3.65
## 17 2 booth -3.79
## 18 2 get -3.82
## 19 2 come -3.94
## 20 2 your -3.94
## 21 3 can -3.12
## 22 3 differ -3.26
## 23 3 get -3.37
## 24 3 dont -3.44
## 25 3 your -3.46
## 26 3 great -3.47
## 27 3 good -3.51
## 28 3 today -3.63
## 29 3 see -3.75
## 30 3 organ -3.80
## 31 4 great -2.70
## 32 4 session -2.78
## 33 4 year -3.45
## 34 4 siop -3.61
## 35 4 see -3.63
## 36 4 work -3.63
## 37 4 amp -3.67
## 38 4 take -3.72
## 39 4 morn -3.73
## 40 4 mani -3.83
## 41 5 session -2.37
## 42 5 one -2.79
## 43 5 can -3.14
## 44 5 work -3.50
## 45 5 manag -3.69
## 46 5 amp -3.92
## 47 5 peopl -3.92
## 48 5 day -3.96
## 49 5 great -4.00
## 50 5 develop -4.05
## 51 6 cant -2.96
## 52 6 one -2.96
## 53 6 say -3.03
## 54 6 wait -3.10
## 55 6 now -3.40
## 56 6 today -3.52
## 57 6 learn -3.53
## 58 6 data -3.66
## 59 6 can -3.69
## 60 6 let -3.71
## 61 7 social -2.40
## 62 7 great -3.05
## 63 7 know -3.36
## 64 7 assess -3.50
## 65 7 session -3.51
## 66 7 now -3.61
## 67 7 will -3.62
## 68 7 job -3.72
## 69 7 use -3.80
## 70 7 back -3.84
## 71 8 session -2.07
## 72 8 great -2.84
## 73 8 learn -2.99
## 74 8 like -3.08
## 75 8 research -3.35
## 76 8 look -3.81
## 77 8 work -4.04
## 78 8 peopl -4.09
## 79 8 today -4.10
## 80 8 still -4.19
## 81 9 like -2.99
## 82 9 day -3.06
## 83 9 way -3.31
## 84 9 tri -3.39
## 85 9 room -3.44
## 86 9 session -3.62
## 87 9 think -3.70
## 88 9 want -3.84
## 89 9 booth -3.87
## 90 9 know -3.88
## 91 10 take -2.69
## 92 10 good -3.15
## 93 10 dont -3.20
## 94 10 game -3.27
## 95 10 siop -3.36
## 96 10 analyt -3.48
## 97 10 need -3.51
## 98 10 research -3.51
## 99 10 look -3.57
## 100 10 new -3.64
## 101 11 work -2.92
## 102 11 engag -3.15
## 103 11 session -3.27
## 104 11 learn -3.37
## 105 11 can -3.61
## 106 11 great -3.67
## 107 11 employe -3.69
## 108 11 amp -3.73
## 109 11 get -3.79
## 110 11 year -3.90
## 111 12 use -2.37
## 112 12 question -3.16
## 113 12 one -3.24
## 114 12 twitter -3.26
## 115 12 busi -3.30
## 116 12 thing -3.35
## 117 12 leader -3.36
## 118 12 day -3.56
## 119 12 data -3.65
## 120 12 learn -3.79
## 121 13 student -3.21
## 122 13 work -3.24
## 123 13 present -3.34
## 124 13 look -3.43
## 125 13 new -3.48
## 126 13 employe -3.54
## 127 13 see -3.81
## 128 13 want -3.83
## 129 13 make -3.86
## 130 13 organ -4.00
## 131 14 committe -2.97
## 132 14 like -3.34
## 133 14 come -3.45
## 134 14 join -3.46
## 135 14 thank -3.53
## 136 14 discuss -3.54
## 137 14 work -3.58
## 138 14 now -3.58
## 139 14 present -3.62
## 140 14 dont -3.66
## 141 15 great -2.56
## 142 15 session -2.59
## 143 15 thank -3.10
## 144 15 like -3.26
## 145 15 new -3.39
## 146 15 today -3.49
## 147 15 employe -3.70
## 148 15 booth -3.86
## 149 15 back -3.87
## 150 15 dont -3.91
## 151 16 see -2.65
## 152 16 thank -3.17
## 153 16 focus -3.19
## 154 16 siop -3.20
## 155 16 session -3.31
## 156 16 help -3.56
## 157 16 get -3.56
## 158 16 amp -3.58
## 159 16 assess -3.76
## 160 16 work -3.82
## 161 17 get -2.60
## 162 17 day -3.05
## 163 17 today -3.30
## 164 17 field -3.34
## 165 17 come -3.65
## 166 17 last -3.66
## 167 17 learn -3.86
## 168 17 peopl -3.95
## 169 17 phd -3.96
## 170 17 good -3.97
## 171 18 session -2.98
## 172 18 realli -3.24
## 173 18 thank -3.24
## 174 18 poster -3.29
## 175 18 time -3.41
## 176 18 think -3.65
## 177 18 look -3.66
## 178 18 best -3.68
## 179 18 present -3.77
## 180 18 talk -3.79There’s a bit of tea-leaves-reading here again, but now instead of trying to interpret individual items, we are trying to identify emergent themes, similar to what we might do with an exploratory factor analysis.
For example, we might conclude something like:
- Theme 1 seems related to travel back from the conference (chicago, conference, home, back, time).
- Theme 2 seems related to organizational presentations of research (research, work, team, booth).
- Theme 7 seems related to what people will bring back to their jobs (social, assess, use, job, back).
- Theme 9 seems related to physical locations (room, session, booth).
- Theme 11 seems related to learning about employee engagement (work, engage, session, learn, employee).
- Theme 14 seems related to explaining SIOP committee work (committee, like, join, thank, discuss, present).
And so on.
At this point, we would probably want to dive back into the dataset to check out interpretations against the tweets that were most representative of their categories. We might even cut out a few high-frequency words (like “work” or “thank” or “poster”) because they may be muddling the topics due to their high frequencies. Many options. But it is important to treat it as a process of iterative refinement. No quick answers here; human interpretation is still central.
In any case, that’s quite enough detail for a blog post! So I’m going to cut if off there.
I hope that despite the relatively rough approach taken here, this has demonstrated to you the complexity, flexibility, and potential value of NLP and topic modeling for interpreting unstructured text data. It is an area you will definitely want to investigate for your own organization or research.
Every year, I post some screenshots of my insane schedule for seeing all of the technology-related content at the annual conference of the Society for Industrial and Organizational Psychology (SIOP). As began in earnest last year, the technology program this year is sizable too. Yet my schedule is even worse than last year somehow, and after accounting for all of my scheduled meetings and sessions in which I’m presenting, I had a grand total of three conference slots open to attend presentations of my own choosing. One of them, I chose to sleep!
So, if you’re interested in technology in I-O psychology at SIOP 2018, let me tell you what I’m doing so that you can attend! I’m excited about all of these, and I’m centrally involved in all but two of them. If you come to any, please find me and say hello! I’ll also be active on Twitter as usual.
- Pre-Conference Workshop: Modern Analytics for Data Big and Small on Wednesday, April 18, both AM and PM workshops. Dan Putka (HumRRO) and I will be given a practical workshop on modern techniques for data acquisition (web scraping/APIs), processing of unstructured text data (natural language processing), and advanced predictive modeling (supervised machine learning) and their applications to I-O science and practice. I’ve heard we are almost full but believe there are still a few slots available!
- Technology in Assessment Community of Interest on Thursday, April 19 at 10:00 AM in Mayfair. Have you been feeling lost lately in regards to tech in assessment in I-O? Does it seem like the research literature is so ancient that it feels like it’s from another era? Do you want to help fix that, and become part of a community of like-minded researchers and practitioners? If so, come to this session! Our goal is to work through some of the biggest issues in a high-level pass at discussion, with the goal of seeding some activities for a longer-term, more permanent virtual community of assessment tech researchers and practitioners! Join us!
- SIOP Select: I-O Igniting Innovation on Thursday, April 19 at 12:00PM in Sheraton 5. In this invited SIOP session, I’ll be introducing a panel of experts in the area of innovation, particularly including I-Os and non-I-Os that have worked in startups! Come hear how I-O can and do contribute to Silicon Valley.
- SIOP Select: TeamSIOP Gameshow Battle for the TeamSIOP Theme Track Championship on Thursday, April 19 at 1:30PM in Sheraton 5. I don’t want to spoil the surprise on what this is, but if you want to be on a game show at SIOP, this is your chance!
- Recruitment in Today’s Workplace Community of Interest on Thursday, April 19 at 4:30PM in Mayfair. In this community of interest, let’s discuss how recruitment has fully entered the digital era and what I-O needs to do to stay on top of the changes afoot.
- Using Natural Language Processing to Measure Psychological Constructs on Friday, April 20 at 8:00AM in Sheraton 2. In this symposium chaired by one of my PhD students with me as discussant, hear from several different academic and practitioner teams about how they are using natural language processing, a data science technique for utilizing text data in quantitative analyses.
- SIOP Select: A SIOP Machine Learning Competition: Learning by Doing on Friday, April 20 at 10:00AM in Chicago 6. Several months ago, nearly 20 teams competed to get the best, most generalizable prediction in a complex turnover dataset. The four winning teams are presenting in this session. In full disclosure, we weren’t one of them! Team TNTLAB was right middle of the pack – yet our R^2 was a full .02 lower than the winning team! We’re definitely going to be attending this one to learn what we’re going to do next year.
- Where Do We Stand? Alternative Methods of Ranking I-O Graduate Programs on Friday, April 20 at 11:30AM in Gold Coast. In the current issue of TIP, we got a whole bunch of new ranking systems for I-O psychology graduate programs, including one put together by TNTLAB! In this session, you get to learn exactly where these ranking systems came from. I expect some stern words and maybe even some yelling from the audience, so this is definitely one to attend!
- Employee Selection Systems in 2028: Experts Debate if Our Future “Bot of Not?” on Friday, April 20 at 3:00PM in Chicago 9. In this combination IGNITE and panel discussion, each presenter (including me!) will share their vision of just how much artificial intelligence will have taken over selection processes in organizations by 2028.
- Technology-Enhanced Assessment: An Expanding Frontier on Friday, April 20 at 4:00PM in Gold Coast. This is my first “optional” session of the conference, but it looks to be a great one! Learn how PSI, Microsoft, ACT and Revelian are innovating in the assessment space. I hope to learn about the newest of the new!
- Make Assessment Boring Again: Have Game-based Assessments Become Too Much Fun? on Saturday, April 21 at 10:00AM in Huron. In this panel discussion, a group of practitioners and one lone wolf academic (me!) will discuss the current state of game-based assessments and how I-O is (and is not) adapting to them.
- SIOP Select: New Wine, New Bottles: An Interactive Showcase of I-O Innovations on Saturday, April 21 at 11:30AM in Chicago 6. This session is my brainchild, so I am really hoping it is fantastic! I’ve invited three I-O practitioners that I think represent the height of innovation integrating computer science and I-O psychology to reveal just how they did it. But they can’t just talk the talk – they’ve got to walk the walk. We’ll see live demos in front of the whole room with naive audience members which I will select live from the audience. No plants, I’m keeping them honest! But that means the tech has got to be perfect! Check it out!
- Forging the Future of Work with I-O Psychology on Saturday, April 21 at 1:30PM in Superior A. In this session, learn about the results from the SIOP Futures Task Force (which I was on and am leading next year!) exploring how I-O psychology and SIOP need to adapt to survive in this increasingly constantly changing world of work.
- IGNITE + Panel: Computational Models for Organizational Science and Practice on Saturday, April 21 at 3:00PM in Sheraton 5. This is my second optional session, and I’m going mostly because I want to know what an IGNITE session about computational models will look like! This is a crazy idea even on the face of it! But Jay Goodwin (USARI) and Jeff Vancouver are on it, so I know it’s going to be amazing!
I hope to see you there! Safe travels to all!
As part of a project we completed assessing interdisciplinarity rankings of I-O psychology Ph.D. programs to be published in the next issue of The Industrial-Organizational Psychologist, we created a database containing a list of every paper ever published by anyone currently employed as faculty in an I-O psychology Ph.D. program as recorded in Elsevier’s Scopus database (special thanks to Bo Armstrong, Adrian Helms and Alexis Epps for their work on that project!). Scopus is the most comprehensive database of research output across all disciplines, so that is why we turned to it for our investigation of interdisciplinarity. But the dataset provides a lot of interesting additional opportunities to ask questions about the state of I-O psychology research using publication population data for some field-level self-reflection. No t-tests required when you have population data. I’ve already used the dataset once to very quickly identify which I-Os have published in Science or Nature. The line between self-reflection and naval gazing can be a thin one, and I’m trying to be careful here, but if you have any ideas for further questions that can be answered with these bibliographic data, let me know!
For this first real delve into the dataset, I wanted to explore the relative popularity of I-O psychology’s “top journals.” To get the list of the 8 top journals (and I chose 8 simply because the figure starts to get a bit crowded!), I simply counted how many publications with an I-O psychology faculty member on them appear in each of these journals (you will be able to get more info on this methodology in the TIP article in the next issue along with a list of the top hundred outlets). But importantly, that means my database doesn’t contain two groups of people: I-O practitioners and business school academics. It also doesn’t contain the total number of publications within those journals over years. Those are two important caveats for reasons we’ll get to later.
First, I looked at raw publication counts using loess smoothing.
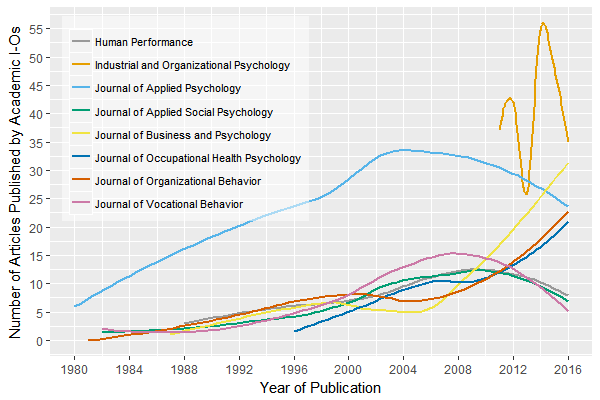
As you can see, the Journal of Applied Psychology has been the dominant outlet for I-O psychology academics for a long time – but that seems to have recently changed. The Journal of Business and Psychology actually published more articles by academic I-O psychologists in 2016 than JAP did. In fact JAP appears to have published fewer and fewer articles by I-Os since around 2001. There are a few potential explanations for this. One, JAP might be published fewer articles in general; two, JAP may be publishing more research by business school researchers instead of I-O academics; three, JAP may be publishing more research by practitioners. I suspect the cause is not option 3.
Also notable is the volatility of Industrial and Organizational Psychology Perspectives, but this is easily attributable to highly varying counts of commentaries considering IOP‘s focal-and-commentary format.
In addition to overall publishing popularity, relative popularity is also of interest. Relative popularity assesses how many academic I-Os have published within a journal relative to each journal’s year with the most I-O publications. This mostly makes change patterns a bit easier to see. This figure appears next.
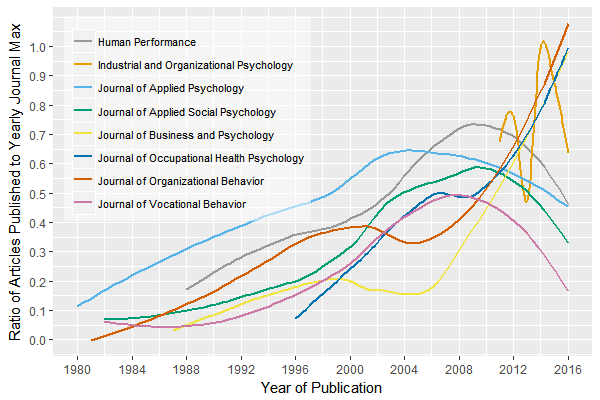
Of interest here are trajectories. Journals clearly fall into one of three groups:
- Consistency. IOP is the most consistent, as you’d expect; it’s truly the only journal “for I-Os.” Any articles not published by I-O academics are likely published by I-O practitioners.
- Upwards momentum. JBP, Journal of Occupational Health Psychology, and Journal of Organizational Behavior all show clear upward trajectories; they are either becoming more popular among I-Os or perhaps simply publishing more work in general with consistent “I-O representativeness” over time. All three published more work by I-O academics in 2015/2016 than they ever have before, as seen in the swing up to 100% at the far right of the figure.
- Decline. JAP, Human Performance, Journal of Applied Social Psychology, and Journal of Vocational Behavior are all decreasing in popularity among academic I-Os. Most journals either maintain their size or increase over time, which suggests that it is popularity with I-O academics in particular that is decreasing. Some of these are more easily explainable than others. JVB for example has been experiencing a long shift back towards counseling psychology over the last decade, which is itself moving even further away from I-O than it already was. Less than half of the editorial board are currently I-Os, and the editor is not an I-O. HP has only been publishing 2 to 5 articles per issue over the last several years, which could reflect either tighter editorial practices or declining popularity in general versus with I-Os. JASP is not really an I-O journal, and I suspect its reputation has likely suffered as the reputation of social psychology in general has suffered due to the replication crisis, but that’s a guess.
To I-Os, JAP is the most interesting of this set and difficult to clearly explain; they still appear to publish the same general number of articles per issue that they have for decades, but from a casual glance, it looks like more business school faculty have been publishing there, which of course also brings “business school values” in terms of publishing – theory, theory, and more theory. This decline among I-Os might also be reflected in its dropping citation/impact rank; perhaps JAP is just not publishing as much research these days that people find interesting, and as a result, I-O faculty are less likely to submit/publish there too. As the face of I-O psychology to the APA and much of the academic world in general, this is worth watching, at the very least.
Completing this analysis helped me realize that something I really want to know is what proportion of publications in all of these journals are not by I-Os. I suspect that the journals that the average I-O faculty member considers “primary outlet for the field” are changing, and that number would help explore this idea.
In the data we already have, there are some other interesting general trends to note; for example, the trajectories of all journals are roughly the same pre-2000. JAP started publishing I-O work a lot earlier than JOB, but their growth curves are very similar after accounting for the horizontal shift in their lines (i.e., their y-intercepts). The most notable changes across all journals occur in 2000 where almost all of the curves are disrupted, with several journals arcing up or down, then again in 2006. The first of these can probably be best explained as “because the internet,” but the cause of the 2006 shifts is unclear to me.
As a side note, this analysis took me a bit under an hour using R from “dataset of 11180 publications” to “exporting figures,” a lot of which was spent making those figures look nice. If you don’t think you could do the same thing in R in under an hour, consider completing my data science for social scientists course, which is free and wraps around interactive online coding instruction in R provided by datacamp.com, starting at “never used R before” and ending with machine learning, natural language processing, and web apps.


